Choose standard metadata for your dataset
Before starting your project or your experiments, consider what repositories could be appropriate to publish your datasets. For biomolecular data in Life Sciences, EMBL-EBI Data Submission wizard will guide you to the right archive for your data in a few simple steps.
After you have found the appropriate repository for your data, check if a metadata schema is required and download or write down the required metadata fields of checklists, or at least the mandatory ones. If the repository doesn’t require a specific standard metadata, you can choose a generic and/or a discipline-specific one for your dataset. You can also use more than one checklist, for example, to describe a multi-disciplinary dataset.
Use metadata checklist in spreadsheets
An easy way to apply metadata to your dataset is using a spreadsheet (such as Excel and Google Sheets). Excel and Google Sheets are a simple way to create metadata checklists with controlled vocabulary drop-down lists (data validation in Excel and Google Sheets). In practice, you can put attributes or metadata fields in columns, and have one row of values or descriptions per measurement. The top row with the metadata fields can be made write protected (cell protection in Excel and Google Sheets and frozen to be always visible (freeze rows/columns in Excel and Google Sheets).
Levels of metadata
Consider having two types of information in metadata spreadsheets or codebooks:
- General information about your overall study, containing metadata fields such as “Study Title”, “Study description”, “Experimental Factors”, “Study Design” etc.
- Description of the individual observations and measurements, containing metadata fields as column names, such as “Replicate N”, “Date”, “Length”, “Datafile name” etc.
It is also possible to use a README file to describe metadata fields about the overall study and define controlled vocabularies for the attributes in the columns. To avoid confusion on the interpretation of the value of metadata fields, you should always have the exact definition and scope of your used metadata fields. If you use standard metadata, you can refer to the definitions of the standard, rather than having to describe the metadata fields yourself. For example, not everybody understands automatically that ‘length’ describes how tall a subject is, or how it is measured.
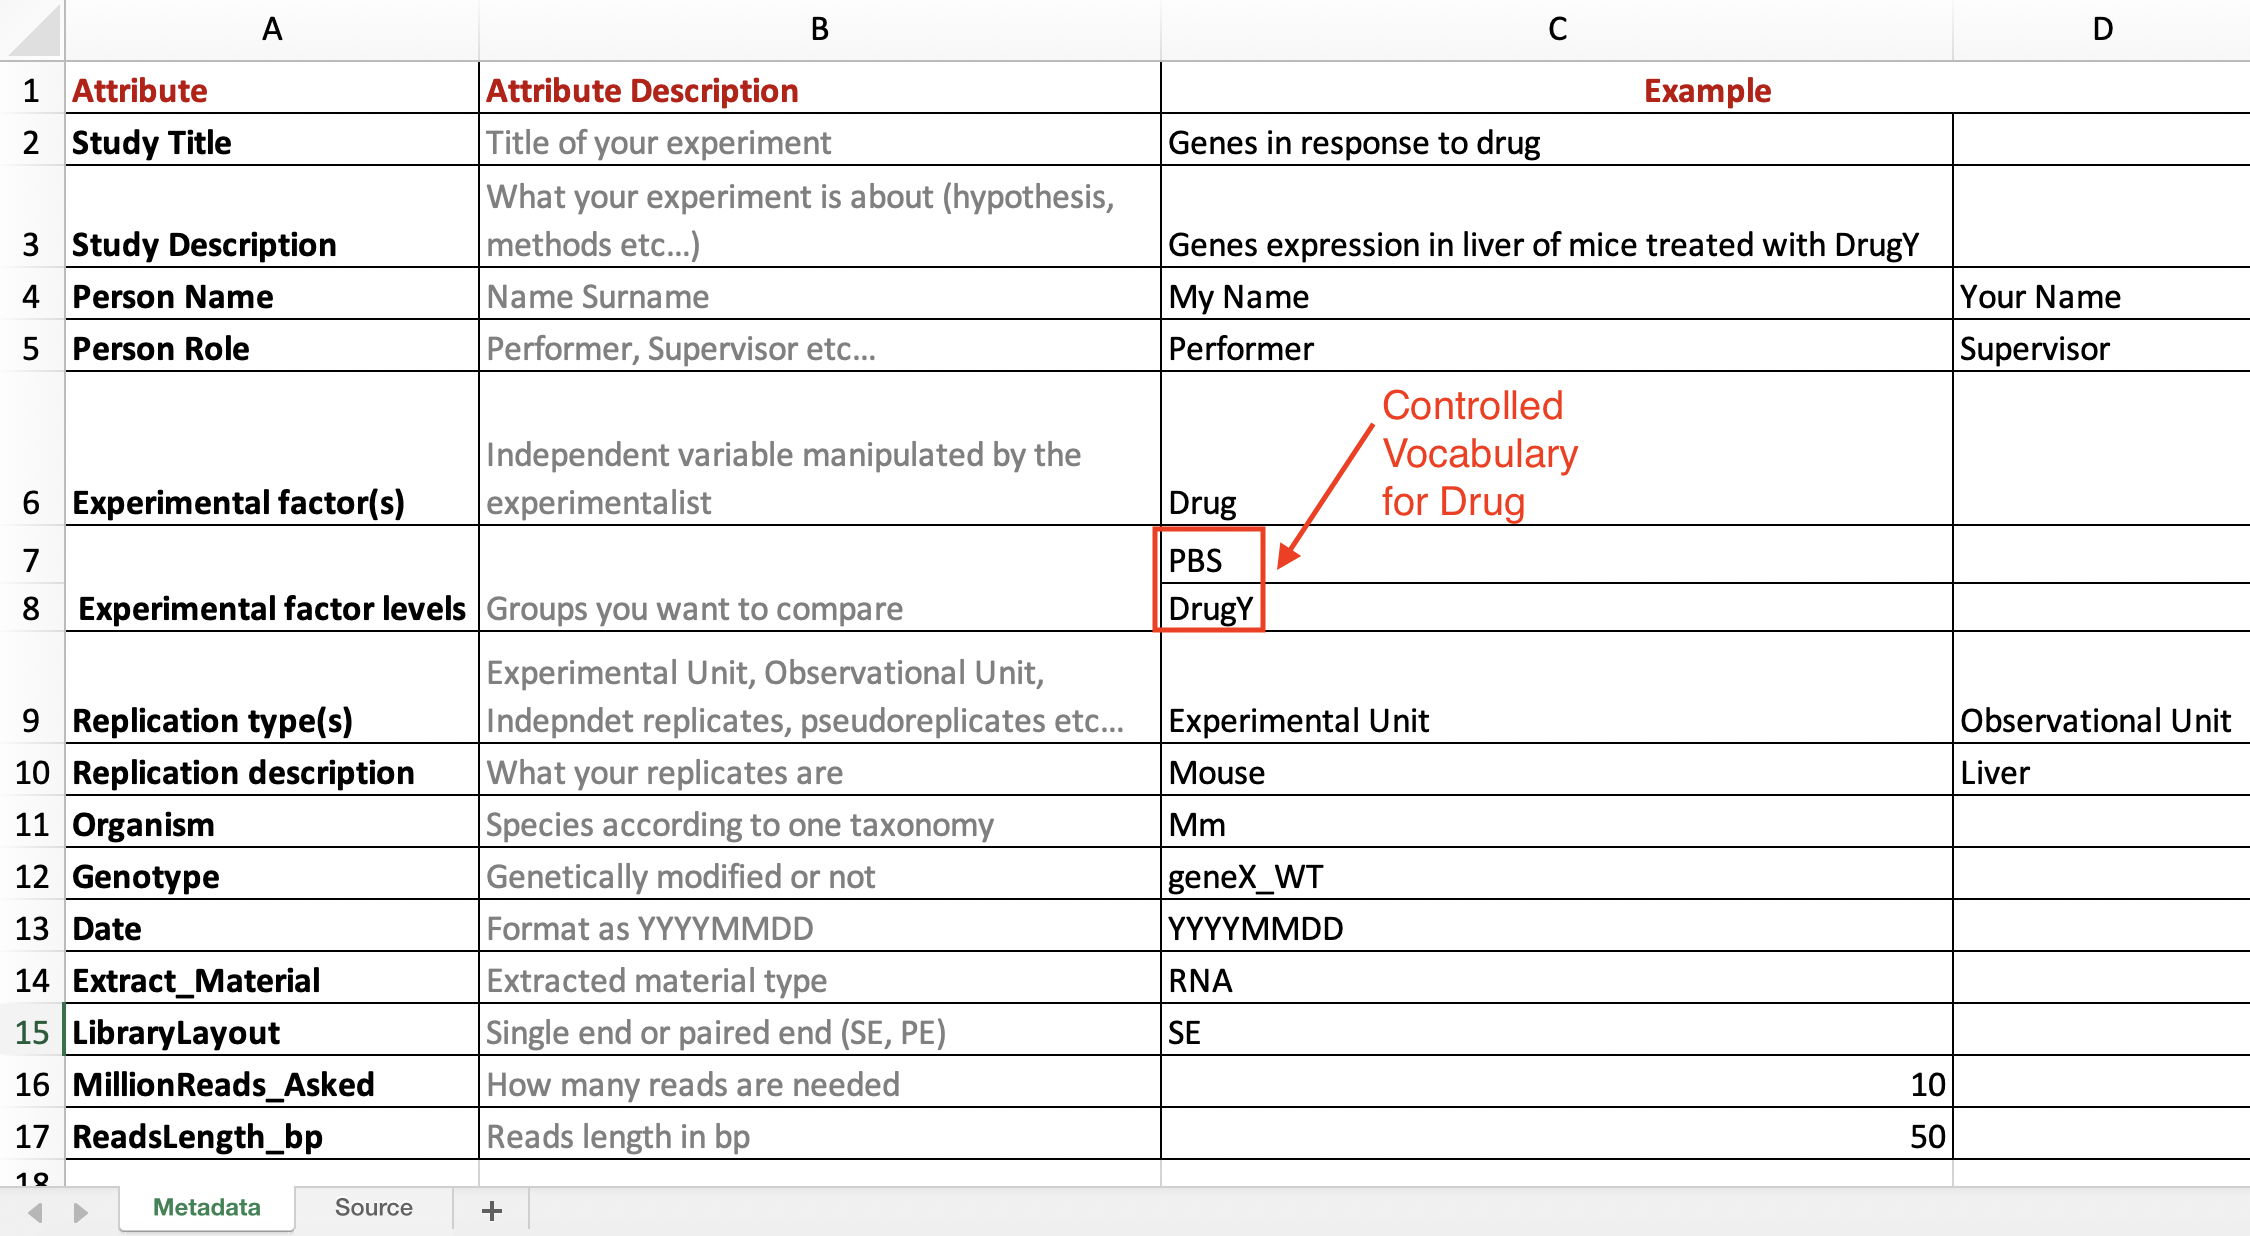
Figure 1. Metadata fields description and controlled vocabulary.
Usually, a (meta)data sheet holds 30 or more attributes to describe data at individual observation level. Don’t be afraid to have many attributes in your spreadsheet; on the contrary, with detailed metadata fields you can easily select specific measurements based on the information noted down in the columns.
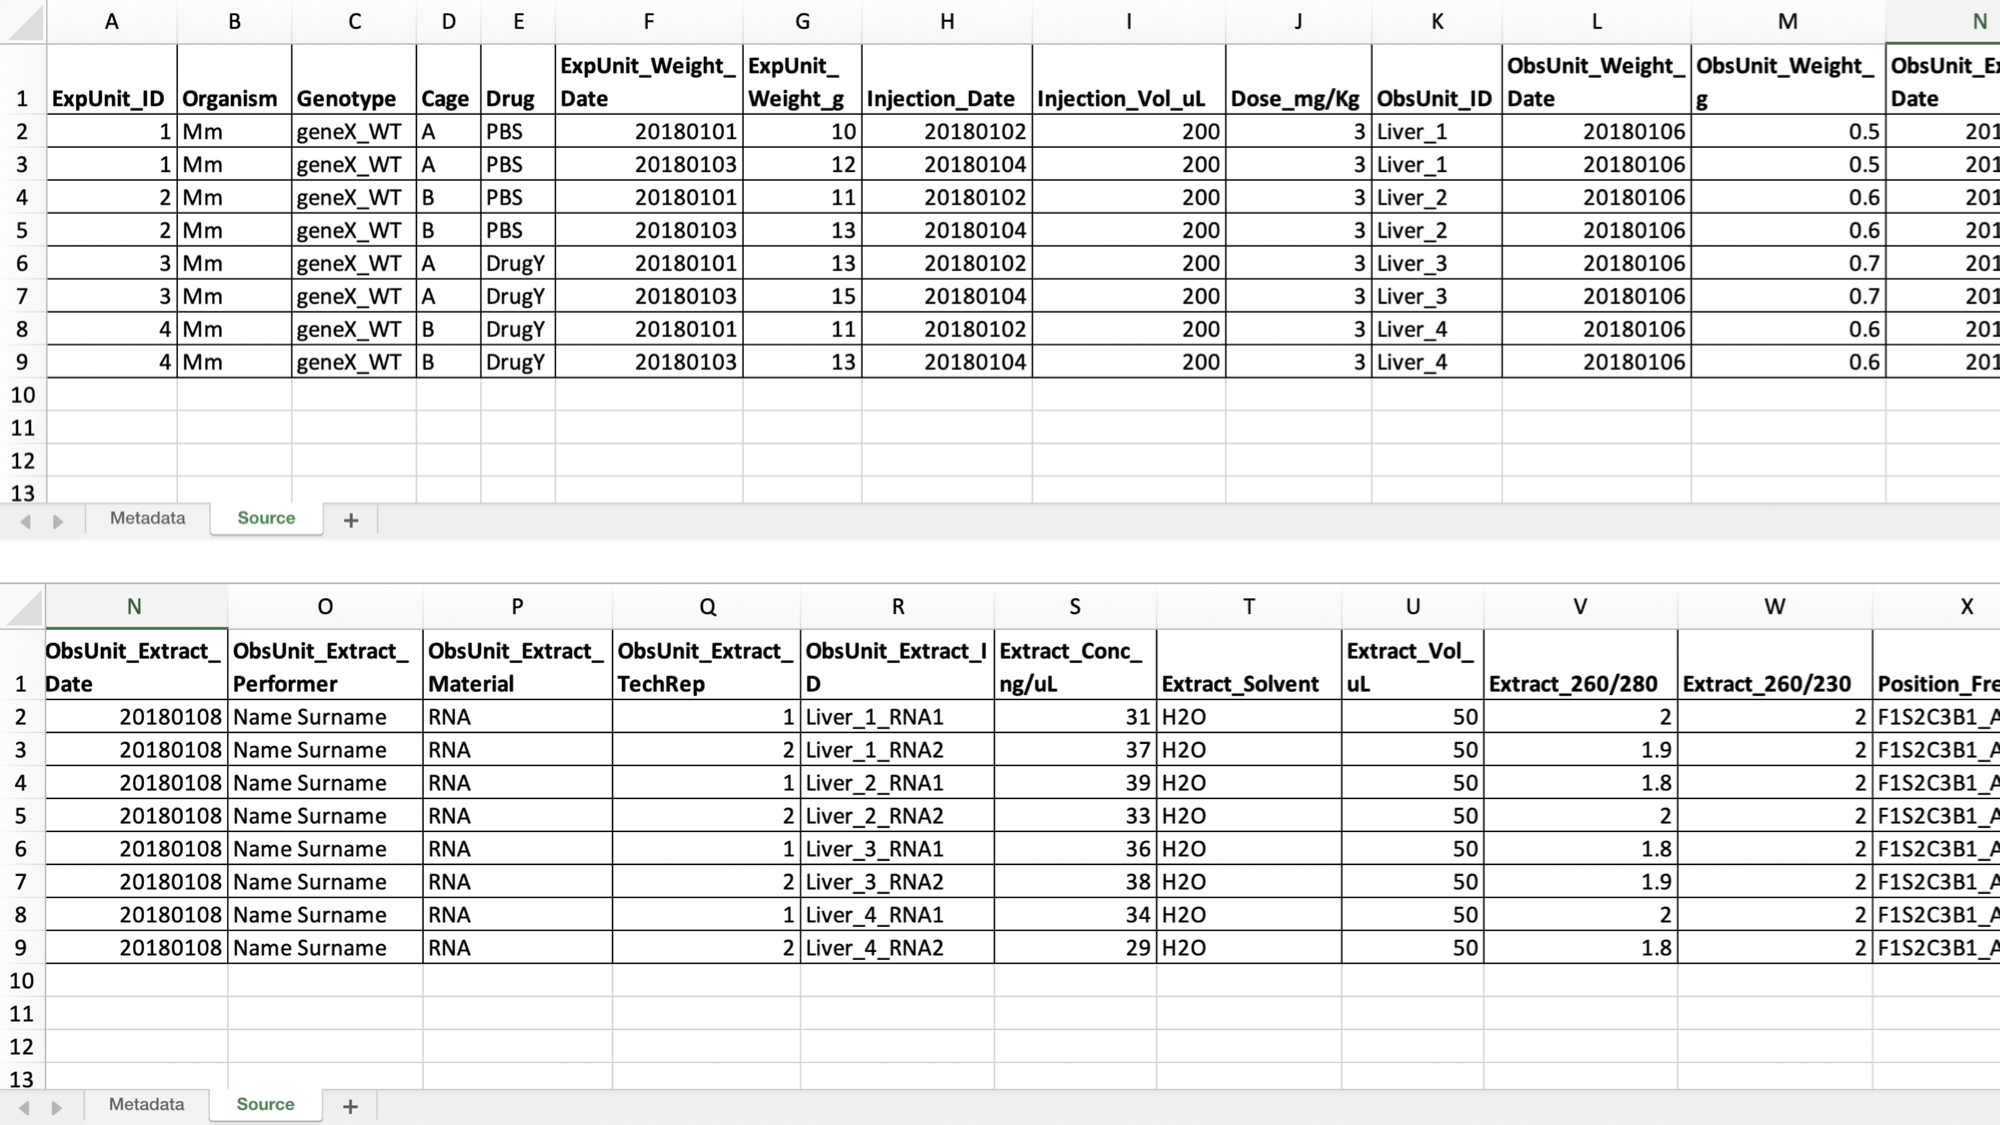
Figure 2. Metadata spreadsheet with more than 30 attributes
If applicable include a field that takes the name of the file that actually holds the measurement data and other files that give detailed information (i.e. the exact protocol used or scripts of analyses done on your samples, etc.).
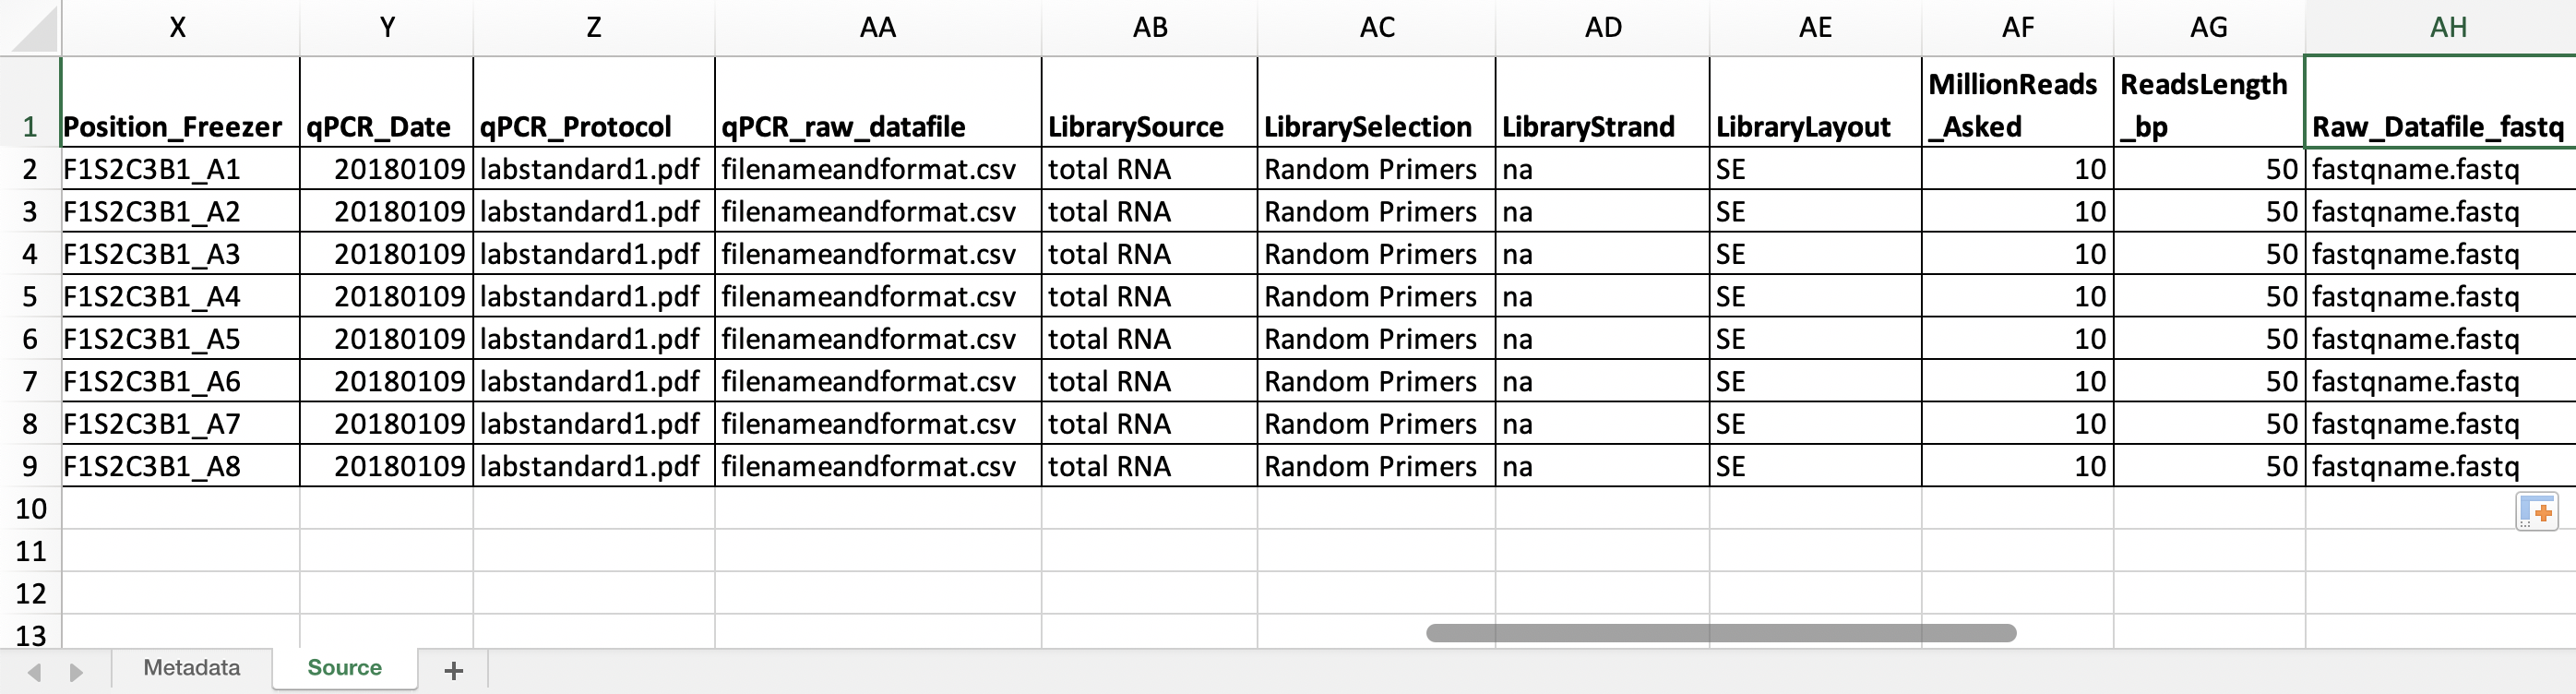
Figure 3. Metadata spreadsheet with fields that take the name of the used protocol and the datafile containing the raw data.
Especially if you work with several people in a project, or similar experiments or measurements are done regularly in your research group, it is a good idea to develop metadata templates for the collected data and have controlled vocabulary to fill in these templates. If you standardise your metadata sheet, it can be reused and different experiments can be easily compared.
Tips
-
Make metadata sheets before or simultaneously with data production.
You could start making them while you are writing the project or the data management plan. It will help you estimate data volume and potential ethical issues. -
Add all information needed to understand and reproduce your experiments as metadata.
Metadata fields could be dose, time, date, frequency, measurement unit, geographical coordinates, unexpected events, parameter settings, name and version of the software used etc. Include reference to used protocols and raw or processed datafiles. Add also variables that you don’t need immediately (ex: age or sex), but that could be useful to “your future-self” and others in the future. The context of the data generation should be richly annotated to maximize its reusability: mention any particularities or limitations about the data that other users should be aware of. Ensure that all variable names are explained or self-explanatory (i.e., defined in the research field’s controlled vocabulary). Clearly specify the version of the archived and/or reused data. -
Use controlled vocabulary and data validation.
Use controlled vocabulary and data validation as much as you can to avoid mistakes, such as typos, misspelling, synonymous etc. -
Use standard metadata and ontology.
Use standard metadata and ontology as much as possible, so that your data can be reused and different experiments can be easily compared. -
Do not include calculation nor graphs in the metadata sheet.
Metadata sheet should only contain metadata and/or raw data. For calculation and graphs, make a copy of the spreadsheet. -
Do not use colour code as (meta)data and do not combine multiple variables in one cell.
For more information about data organisation in spreadsheet, see the following websites:
- Data organisation in spreadsheets.
- Data carpentry: Formatting data table in spreadsheets and Formatting problems.
- Preparing tabular data for description and archiving, Cornell University.
- Pivot Table in Excel and Google Sheets.
Sources and further reading
Sources
- Data description in practice, Utrecht University.
- Metadata, UGent.
- UNC Library guide on metadata.
- Research Data Alliance (RDA) - Metadata Standards Directory Working Group.
- The Research Data Management Group at Cornell.
- GO FAIR Principles.